A slightly different topic to the usual today, sparked by the recent string of comments from the central bank policy world about risks of increased market volatility, in particular in fixed income (FI). For example, the BoE’s Financial Policy Committee (FPC) said in their latest meeting statement earlier today (here) that:
The Committee remains concerned that investment allocations and pricing of some securities may presume that asset sales can be performed in an environment of continuous market liquidity, although liquidity in some markets may have become more fragile. Trading volumes in fixed income markets have fallen relative to market size and recent events in financial markets, including in US Treasury markets in October 2014, appear to suggest that sudden changes in market conditions can occur in response to modest news.
This could lead to heightened volatility and undermine financial stability. The Committee judges that there is a need for market participants to be alert to these risks, price liquidity appropriately and manage liquidity prudently.
The Committee asked the Bank and FCA to work together to:
- Encourage and contribute to international work to address data gaps and build a common understanding of vulnerabilities in capital market and asset management activities.
- Deepen understanding of the channels through which UK financial stability could be affected by any market correction and reduction in market liquidity. This will include analysis of the reliance of UK corporate financing and economic activity on market-based sources of finance.
- Gather information from asset managers in the United Kingdom about their strategies for managing the liquidity of their funds in normal and stressed scenarios. This would inform assessment of the extent to which markets are reliant on investment funds offering redemptions at short notice.
- Assess how and why liquidity in relevant markets might have become more fragile drawing on evidence from recent episodes of heightened market volatility.
This information should clarify the extent of any macroprudential risks associated with market liquidity and allow the Committee to assess potential policy mitigants. The Committee asked for a full report at its meeting in September and for an interim report in June.
This followed an interesting BIS paper (here) that also looked at FI liquidity and market-making. It concluded that:
…market-making practices are clearly evolving, putting upward pressure on bid-ask spreads and trading costs, and causing activity to concentrate in the most liquid instruments and move away from the less liquid ones. This could make market liquidity more fragile in the short term, especially in the current low interest rate environment, in which new-issue volume and the participation of interest rate-sensitive investors have increased.
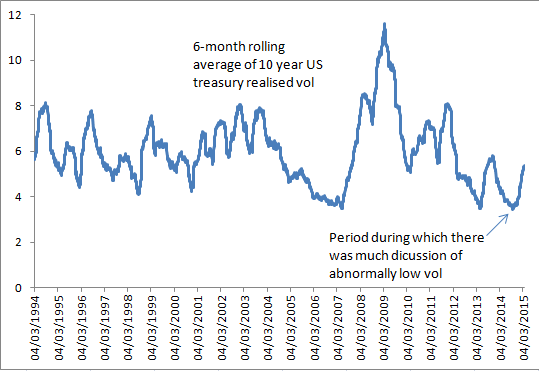
These concerns feel like a pretty dramatic reversal from around the middle of last year, when many policy-makers were talking about the abnormally low volatility observed in markets (although I think at that time most of the focus was on FX vol).
As the BIS paper notes, there aren’t really very many good measures of market liquidity. It highlights three in the sovereign bond space: bid-ask spread, average transaction size and price impact coefficient.

They suggest that with bid-ask spreads in sovereigns back close to their pre-crisis levels, and with transaction sizes in US treasuries back to the highs, that liquidity looks okay (they go on to show more concern about corporate bond liquidity).
But I have been playing around with a few alternative measures and think that there might be a bit more to the sovereign bond liquidity story.
The chart below shows the 12-month rolling average of 10 year US treasury bid-ask spread, normalised on the level of rates, with 95% confidence bands around it.

While it agrees with the BIS that the bid-ask spread is back to pre-crisis levels, the variability in the spread is a lot greater, suggesting increased bouts of temporary liquidity issues.
Looking at realised volatility for 10 year US treasuries, a six-month moving average of the level of daily vol would suggest that mid-2014 was indeed at an all-time low, has picked up recently, but remains pretty muted.
But normalising by the level of rates (ie assuming that realised daily vol is a function of the level of rates), and you get quite a different picture.

After the extreme increase in vol in 2008/09 during the crisis, the decline in 10 year yields and persistence in the daily bp of vol has meant that while mid-2014 was a post-crisis low, it was somewhat above the pre-crisis average. And the recent move up takes realised vol back into crisis territory.
I think it is really important that we look at both of these measures. I think normalising the volatility gives a better read on the underlying liquidity of the market. But I also think that the low level of vol you observe before normalising is important in understanding the second BIS chart on transaction sizes. There is little doubt in my mind that reduced volatility (ignoring the level of rates) has resulted in ever larger positioning/risk-taking. A simple way of thinking about this, is that if a risk-taker is monitoring the VaR of their FI portfolio, then reduced vol allows for increased DV01 for the same amount of (measured) risk. So I’m not sure I take much comfort from the BIS view on transaction sizes.
Of course the implication of this for a risk-taker is that if as rates rise again, the normalised level of vol remains around where it is today, then position sizing would need to be re-thought pretty quickly. And if the ‘vol of vol’ also remains high, then managing drawdowns becomes trickier as well.
For the policy-makers though, the question is whether they are content with safe assets being less liquid than they had been pre-crisis? Liquidity risk was definitely under-priced pre-crisis. During the crisis it become very over-priced (until central banks stepped in as LoLR). Post-crisis, with the regulatory changes etc will it be fairly priced? I doubt it will be all the time, and so wonder whether central banks need to re-examine not just their role as LoLR, but also as Market-maker of Last Resort (MMLR).

My model of liquidity is a tide that lifts all boats, rather than a balloon getting squeezed. Looking at variations in liquidity for the most liquid assets is one way of taking the measurement which you can extrapolate for less liquid asset classes. Much easier, though, is the reverse: look at markets which are on the less liquid end and pay attention when they experience problems. The tide analogy holds here as this is the technique you would use to judge whether an actual tide is coming in or going out.
Another idea: I wonder if any one tail measures are more useful? In other words, focus on the days or periods of (locally) abnormally low liquidity and then compare those across periods.
LikeLike
I think the tide analogy is a good one, and a useful starting point for liking at the issue is to look at the less liquid end first. One problem with that approach might be what the BIS authors argue though, that we maybe seeing liquidity bifurcation. Ie the relationship between different assets on the liquidity spectrum is changing. But as I said in my post, I’m not sure I agree with that conclusion anyway.
LikeLike
The problem is that there is no dissection of what makes up this liquidity (not a criticism of your article, more the banksters). There is different types of liquidity providers, and that liquidity has different ways of interacting with the market.
Take the algos – The HFT’s are scalping in between the spread constantly, everyone knows it, how much does that contribute to current volume nobody is quite sure but it is widely understood to be anywhere from 40-60% of volume depending on what market you trade.
I think the situation regarding liquidity is actually much worse that the headline figure – HFT’s weren’t really around in the early 00’s. I consider liquidity is a bit like a thin crust, within a short range of current spot price there is a lot of liquidity, everything looks great, but once that crust is punctured liquidity is very thin.
Take some recent market moves as examples, both occurring within the past couple of months:
1 The swiss franc, depending on what feed you look at, the eurchf had anywhere from a 3000-6000 pip drop in a few minutes following the removal of the peg. I believe it was the biggest move in the currency markets for over 40 years.
2. Likewise, take the reaction on the USD crosses after the most recent FOMC statement, the dollar had the biggest one day intraday swing since for 6 years – over very little news I may add.
One only has to do a search of ”illusion of liquidity”, something like 0.5 million articles, most within the last year. This is really a big issue now.
The problem, in my view, is that we have had a one way market since 09/10. Risk has been removed by accommodative monetary policy now, and now accommodation is being removed. But the market structure is radically different that it was even 10 years ago.
LikeLike