I argued after the BoE’s February Inflation Report that they were closer to hiking than you might think (here). Since then market pricing has seen the expected timing of the first rate hike get pushed further out to around Sept/Oct 2016, from around April 2016. So what has happened in the past three weeks, and should I be revising my view?
In terms of the data flow, IP came in a little weaker than expected in January, but the trade balance – while noisy from month to month – improved materially. Employment growth surprised on the upside, but so did participation, such that the unemployment rate actually rose by 0.1pp. However, the figures that got the most attention in the labour market release were the wage data. I focus on the regular pay series (excluding bonuses), as does the BoE. In yoy terms if fell one-tenth, to 1.6%, against an expected increase of the same magnitude.
Should this be read as evidence that the increase in wage growth the Bank are looking for (amongst other things) in order to start the process of policy normalisation is failing to materialise? Or worse, reversing, such that the Bank should be considering rate cuts? I don’t think so – at least not yet anyway. The joy of the labour market data is that you can cut it up lots of different ways. Eg if you were to compare the single month yoy change in regular pay growth, it was actually stable at 1.6%. In other words, the decline in the headline 3m/3m yoy growth rate was a base effect. And the single month yoy growth in service sector wages (85% of the economy) actually rose by 0.2pp to 1.9%. All of the weakness was in manufacturing and construction sector (of which the latter is very noisy from month to month). So this did not strike me as the moment to become too worried about the recovery in wages.
Yesterday saw the inflation data surprise a little on the downside, with both core and headline 0.1pp weaker than expected. The news looked to be genuine. Ie it was across a range of components, rather than concentrated in something that would likely bounce back the following month (airfares is the classic example). But in the grand scheme of things, it was not a large amount of news, instead I think downside surprises are going to get more attention in the current environment.
Finally, the sterling effective exchange rate has fallen nearly all the way back to where it was in early February (of course that likely reflects, in part, the decline in rate expectations).
But arguably more important to market pricing than the data over the past three has been: 1) events in the US; and 2) the recent speech by Chief Economist, Andy Haldane speech.
1) Following the March FOMC meeting, where the market reaction saw US rate expectations decline, UK rates largely followed suit. Ie of the 26bp change in the June 16 short sterling yield since the start of March, 15bp can be “explained” by the fall in US rates.

2) The speech by Haldane (see my thoughts here) raised the prospect that the chances of a rate cut were just as good as a hike in the coming period.
So what is the market pricing for Bank Rate? Well in the near-term, a small chance of a rate cut! With the first hike fully priced by Sept/Oct 2016.

I remain of the view that the next move in Bank Rate is up, and put a very low probability on a cut (maybe 5% given current information). And I still believe that first hike could come as early as November this year, not too long after the Fed is expected to hike.
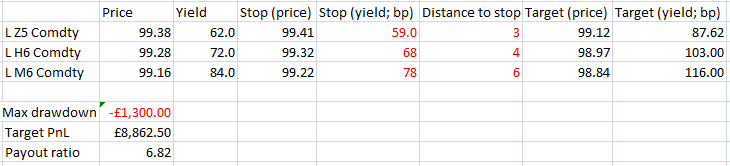
I think that means there is an even better opportunity to sell short sterling now than three weeks ago. Below is a simple trade analysis (assuming 100k DV01) that sets a fairly arbitrary stop (arguable too close to the entry level, but if you really don’t believe the Bank will cut unless the world turns far worse, then the stop could almost be ignored. It is hear just to give some sense of the payout ratio should the Bank hike once in November this year, then again in May next year (ie a very gradual beginning to normalisation).

4 thoughts on “Trade idea: sell short sterling from Dec-15 out to Jun-16”