I have spent a bit of time – over an otherwise very enjoyable Easter long weekend – thinking about the US non-farm payrolls print last Friday. Once again the market reacted strongly to a surprise, but this time it was to the downside. Front-end FI rallied, the dollar sold off and equities kind of went meh, so what. At the time I started typing this on Tuesday afternoon (CET), some of the FI move had reversed, all of the dollar move had and equities continue to push higher. So for now, the enduring impact seems to have been to push back the timing of the first Fed hike a bit more. Maybe that means it’s not worth getting too excited about after all. But much of the commentary around the numbers last Friday (and even reporting of NY Fed Dudley’s speech yesterday) suggested that this was indeed significant news for the outlook – and confirmation of the weakening in growth indicators – and therefore for Fed policy. I’m not so sure (yet)… Non-farm payrolls are both notoriously volatile and subject to substantial revision. That reflects the survey-based nature of the estimate (the household survey is even more volatile due to a smaller sample, but is, in fact, a better measure of total employment). Here are the facts:
- 200K: the average monthly increase in NFP in each of the last three upswings
- 106K: the standard deviation over the same period(s)
- 200-220K: the average monthly NFP increase needed for the remainder of 2015 for the unemployment rate to reach 5% by the end of the year (assuming participation rate remains flat)
- 200K: the average increase in NFP in Q1 (down from 325K in Q4, 240K in Q3 and 280K in Q2)
- +150K: the cumulative monthly consensus forecast error on NFP over the past 6 months – ie the 119K miss this month is more than offset by upside misses over the preceding months.
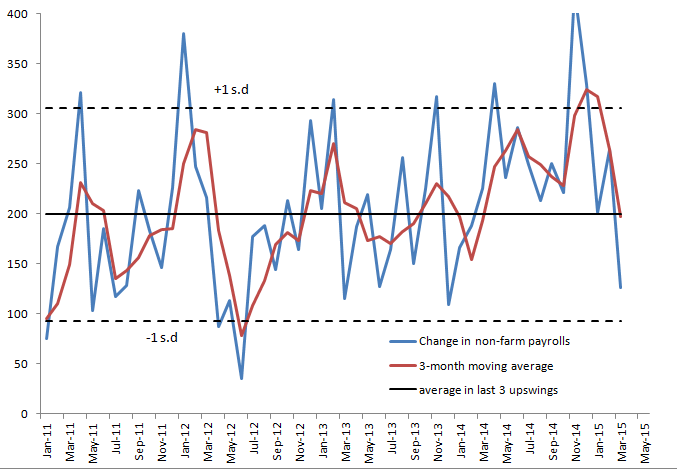 The weaker outturn for March is far from being a statistical outlier. Indeed the strong prints November and December were far more extreme. But given the BLS put a 90% confidence interval of +/- 105K on their monthly change estimates, it could reasonably by anywhere between +231K and +21K. So for now, I am content that while growth likely eased back in Q1 (current tracking estimates are around 1% saar) and employment growth also slowed, that these do not materially change the outlook, or the timing of the first Fed hike. I am still of the view that they start the process of normalisation in September (with June still an outside chance).

One thought on “US data primer: the folly of non-farm payrolls; signal vs noise”